gen_function "sin(x)" -10 10 0.1 | glplotter -glplotter
Table of Contents
1. Introduction
glplotter draws graphs of mathematical functions. You specify a mathematical expression to be used as a function, using a straightforward syntax, like “sin(x) + x^2”.
glplotter can also load a graph from a file. This is useful if your graph data doesn’t come from any mathematical expression — e.g. maybe it’s some collected statistical data. Maybe your data is not even a function at all — actually any shape consisting of line segments may be displayed by glplotter.

2. Download
3. Command-line parameters
You can pass at command-line file names from which to load graphs. Dash (-) as filename means "standard input".
E.g. you could pipe the output of gen_function program to glplotter, like
which will display the graph of sinus for X in [-10; 10]. Commands like
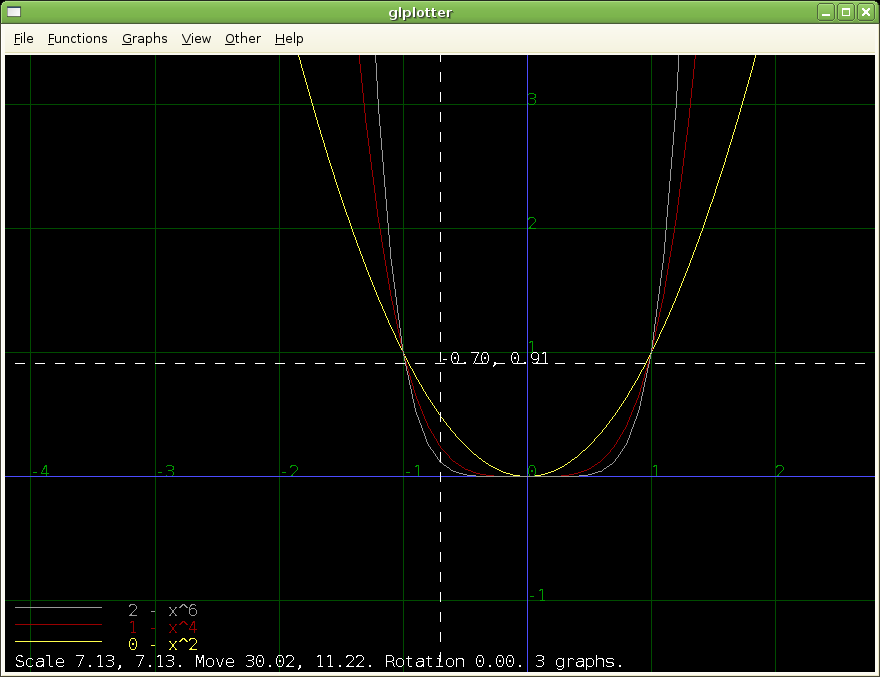
gen_function "sin(x)" -10 10 0.1 > plot.1
gen_function "x^2" -10 10 0.1 > plot.2
glplotter plot.1 plot.2
will display graphs of sinus and x2 at once. Of course, in case of function expressions, it’s usually more comfortable to set them up inside glplotter using "Functions" menu.
Options --light and --dark allow you to choose appropriate color scheme.
Option --custom-size SIZE (or -c SIZE) specifies size for
-
grid shown when
--grid-customwas used (or Ctrl + G pressed) -
numbers scale shown when
--num-scale-customwas used (or Ctrl + S pressed) -
numbers shown when
--numbers-customwas used (or Ctrl + N pressed)
4. Graph file format
Graph for glplotter is actually just a set of line segments. They don’t have to correspond to any function — they can show any shape, they can cross each other etc.
File format:
-
Lines starting with
#(hash) are comments. -
Lines with two float numbers (separated by any whitespae) represent another point of the graph. You can use decimal or scientific float format (like
3.14or10e-3). A line segment will be drawn from this point to the next one (unless abreakwill occur). -
Line with only
breakword means a break in a line segment sequence. -
Line like
name=<graph_name>specifies graph name (will be used in glplotter legend).
Whitespace at the beginning and end of the line is always ignored.
5. gen_function
gen_function generates graph file from given function expression. It’s seldom needed — glplotter can make a graph from function expression on it’s own, see menu "Functions".
Call it like:
gen_function <function> <x1> <x2> <xstep>This will write on standard output the graph of function <function> for x in range [<x1> ; <x2>] (with x sampled at each <xstep> distance). The graph will be in format understood by glplotter.
For example
gen_function "x^2" 0 5 1will write
# File generated by gen_function on 14-3-2004 at 23:34:37
#   function = x^2
#   x1 = 0
#   x2 = 5
#   xstep = 1
name=x^2
 0.0000000000000000E+0000  0.0000000000000000E+0000
 1.0000000000000000E+0000  1.0000000000000000E+0000
 2.0000000000000000E+0000  4.0000000000000000E+0000
 3.0000000000000000E+0000  9.0000000000000000E+0000
 4.0000000000000000E+0000  1.6000000000000000E+0001
 5.0000000000000000E+0000  2.5000000000000000E+0001
6. Syntax of mathematical expressions
Short overview of mathematical expressions syntax: this is really just normal syntax of mathematical expressions, as used in all software and resembling normal mathematical notation. When we deal with function expressions, then x represents the argument, e.g. (x+4)*3+2, sin(x) etc.
For detailed information about syntax and built-in functions, see CastleScript language reference. We use a subset of CastleScript syntax, allowing only a simple expression as a function expression, operating on argument "X".
To improve this documentation just edit this page and create a pull request to cge-www repository.